Overview
Why:
The interpretation of data we generate as biologists is often incomplete without the proper implementation of statistical tools. However, it is commonplace for biologists to be deficient in statistical thinking.
The goal of this workshop is to:
- Remind us about fundamental concepts we may have forgotten (or never learned)
- Expose ourselves to new statistical topics
- Discuss common pitfalls associated with data analysis
Challenge:
- Seek out and read a Statistics Guide. Let the goals outlined above guide your reading. In the section below are a selection of statistics guides to serve as a starting point.
- Choose a topic of interest within the Statistics Guide that you would like to share during the workshop. Example topics include:
- Normal distribution
- Hypothesis testing, confidence intervals and P-Values
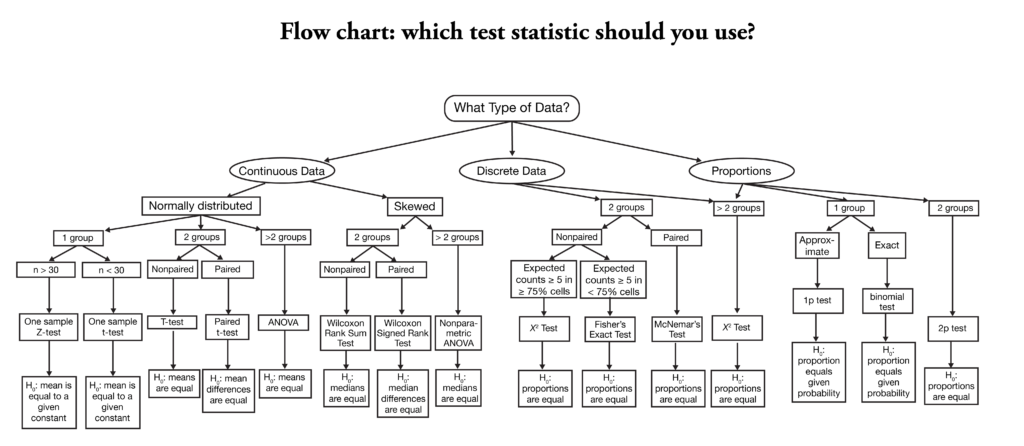
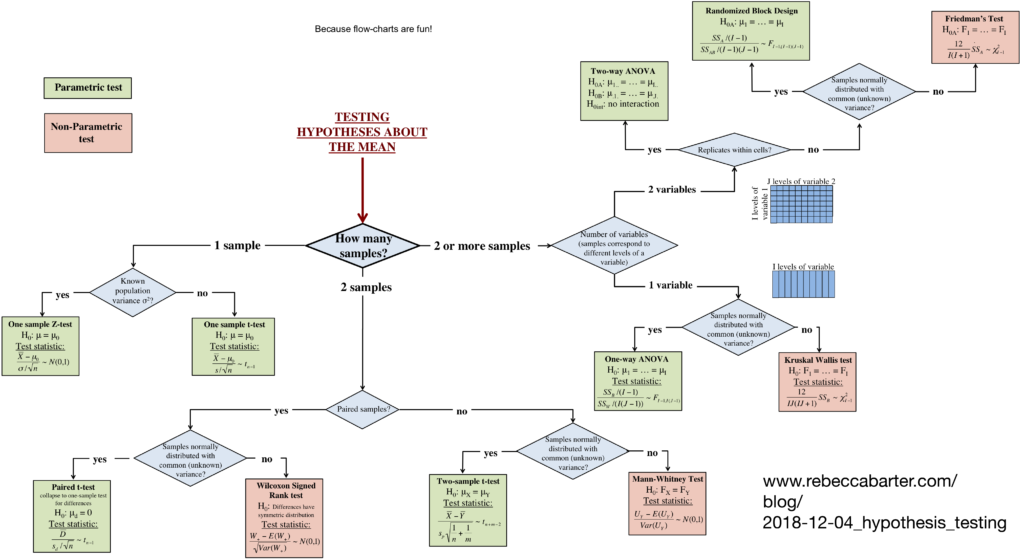
- Test statistics (see flow charts below for more suggestions):
- Chi-Squared Test
- T-test
- Fisher's Exact Test
- Basic regression
- Visualization approaches: Bar plots vs Jitter Plots
- Continuous vs Factorial data
- Prepare 2 - 4 slides detailing your topic to present during the workshop. The slides should introduce the topic, detail how it is useful to or misused by biologists, and an example run-through application of the topic.
The presentations
David's presentation:
Wyatt's presentation:
Sean's presentation:
Code is available upon request
Seré's presentation:
'Charlotte's presentation:
 Loading...
When/Where:
Friday, August 9, 12pm - 1:30pm
MRB 312
Choosing a statistical test:


Statistics Guides:
- The Cartoon Guide to Statistics, by Larry Gonick
- Purchased by Nishimura lab
- OpenIntro Statistics, by David Diez
- PDF available for free download
- Second edition purchased by Nishimura Lab
- Statistics and Probability, by Khan Academy
- Website with lessons and tutorials
- Statistics for Biologists Collection, by Nature Publishing Group
- A series of articles chronicling statistical issues Biologists may face
- Stat Trek
- Website for statistics training and tools
- Think Stats, by Allen B. Downey
- Free PDF
- Introduction to probability and statistics for Python programmers
- Includes code examples and exercises in accompanying Github repository
- A biologist's guide to statistical thinking and analysis, by David Fay and Ken Gerow
- PDF of WormBook chapter co-authored by fellow Front Range C. elegans researcher David Fay
- Explain XKCD
- A wiki-style database of statistics-related XKCD comics
- Includes explanations of the statistical concept referenced in the comic
- Statquest Youtube Videos: